

Beautiful dashboards. Built in minutes. Shared instantly.
Upload Excel or CSV, build and share. no BI experience, no company account, no paid viewer licenses.
- No BI experience required
- Works in your browser
- Refresh from an updated Excel file
Built for
Why teams choose Mizantiq over Excel and Power BI
Build a chart
- Excel
- Manual formulas
- Power BI
- Complex wizards
- Mizantiq
- Seconds
Learning curve
- Excel
- Charts & formulas
- Power BI
- Weeks
- Mizantiq
- Minutes
Sharing
- Excel
- Email files
- Power BI
- Paid viewer licenses
- Mizantiq
- Invite by email
Viewer account
- Excel
- —
- Power BI
- Required, per seat
- Mizantiq
- Free personal account
Company email
- Excel
- —
- Power BI
- Often required
- Mizantiq
- Not needed
Export
- Excel
- Manual, one at a time
- Power BI
- Manual, one at a time
- Mizantiq
- One-click, cycles every value
Many reports (per region/dept)
- Excel
- One by one
- Power BI
- One by one
- Mizantiq
- One click
Canvas size
- Excel
- Fixed print layout
- Power BI
- Fixed report canvas
- Mizantiq
- HD, laptop, square, or custom
Built to solve everyday reporting problems
Dashboards shouldn't take days to Build or cost a fortune to share. We built the tool we wished we had.
Rebuilding the same charts every month
Upload the new Excel file. Your dashboard updates automatically.
Static reports become outdated immediately
Share a live dashboard everyone can explore.
Expensive licenses just to view reports
Invite anyone by email — free for everyone who opens it — no company mail required.
Complex BI tools take weeks to learn
Build interactive dashboards in minutes.
Multiple versions of the same report
Keep one dashboard that's always up to date.
From spreadsheet to shared dashboard in four steps.
1. Upload
Drop in an Excel or CSV file.
2. Build
Pick a chart and your fields — it renders live.
3. Share
Invite anyone by email. No license, no company account.
4. Export
One click per chart, per page, or per slicer value.
From data to a beautiful chart in seconds.
Pick a chart type and your fields in the sidebar — the chart renders live as you configure it. No formulas, no wizards, no trial and error. Once it looks right, drag it anywhere on the canvas and resize it with snap-to-grid handles.
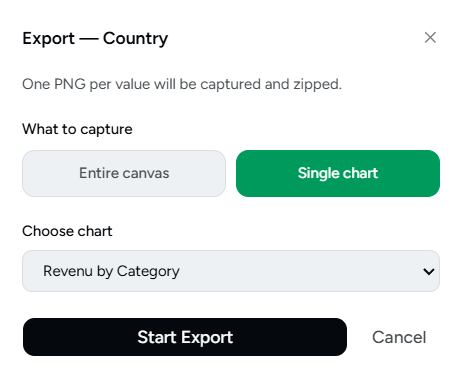
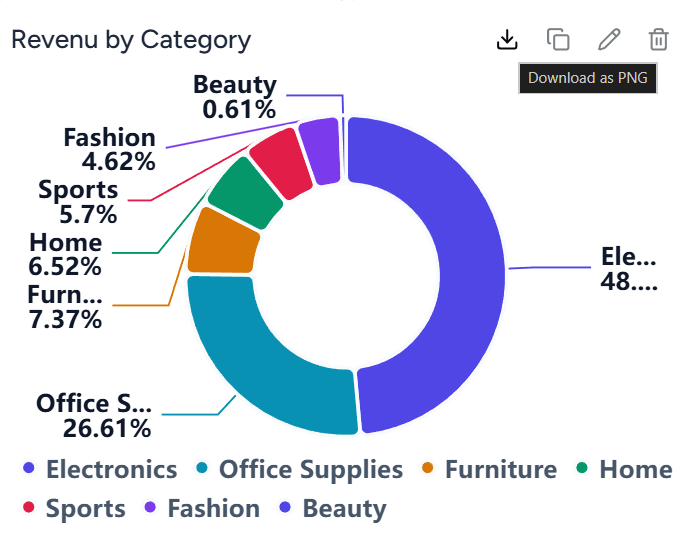
Export exactly what you need, in one click.
Export a single chart to a clean PNG, or the whole dashboard to PDF. Need a version for every hospital, department, region, or salesperson? Pick a slicer, click export, and Mizantiq cycles through every value automatically — for a single chart or the entire canvas — no clicking filters one by one.
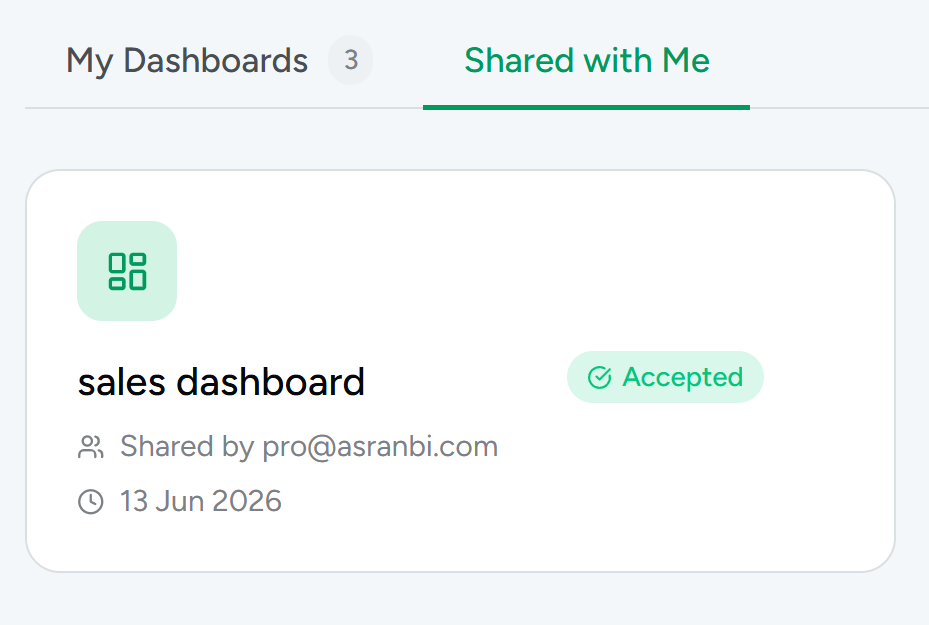
Share with anyone, control who sees it.
Invite people by email — they sign in with any personal account, no company domain or paid viewer license required. Everyone you invite can explore the dashboard in view-only mode, so nothing gets accidentally changed. You always control exactly who has access.
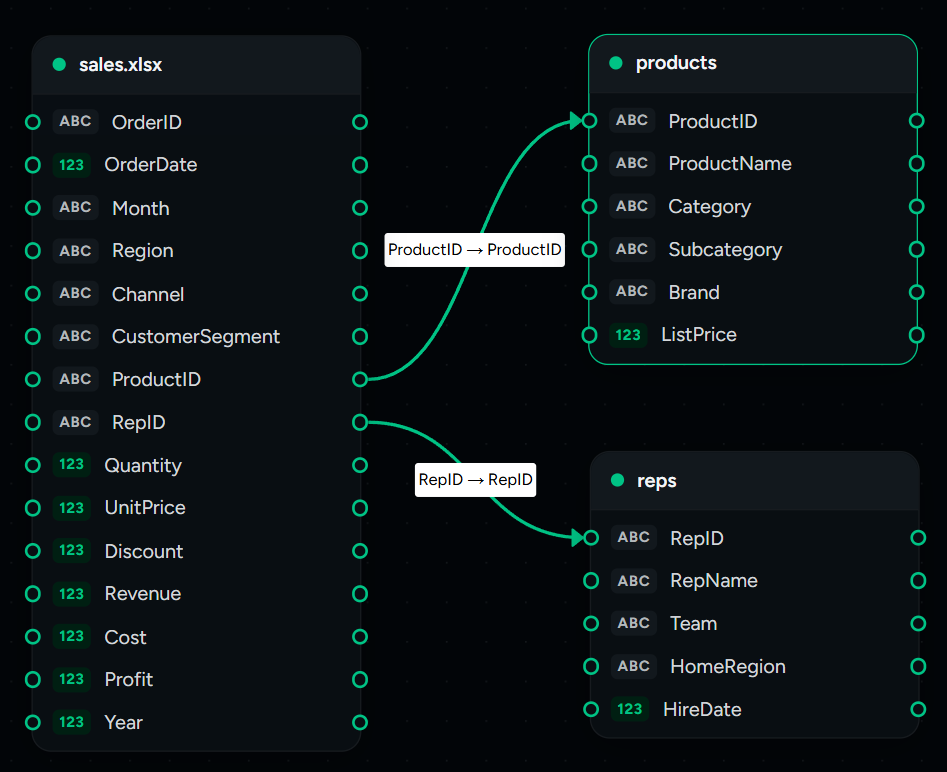
Connect related tables — no VLOOKUPs required.
Your data doesn't always live in one sheet. Upload several tables, then link them on a visual canvas by dragging from one table to another — sales to regions, patients to departments, orders to customers. Build charts that pull fields from across the connected tables, with no merged sheets and no lookup formulas to maintain.
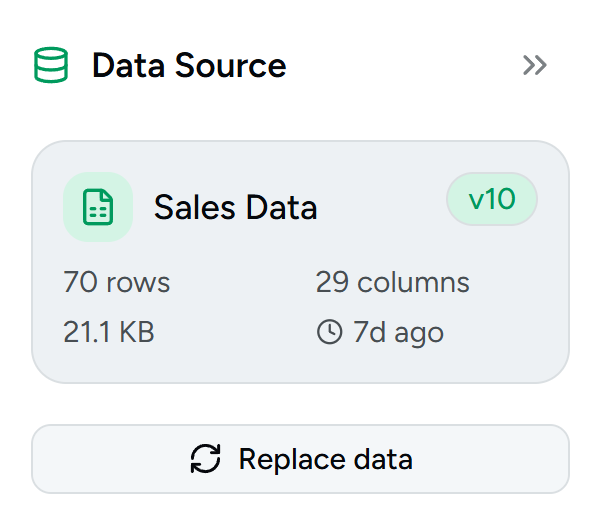
Data changed? Upload the new file — your dashboard catches up.
When your numbers update, upload the new version of your spreadsheet. Mizantiq lines the new data up against your existing charts — and if a column moved or got renamed, it walks you through matching it in a quick dialog. Your charts, layout, and formatting stay exactly as you built them.
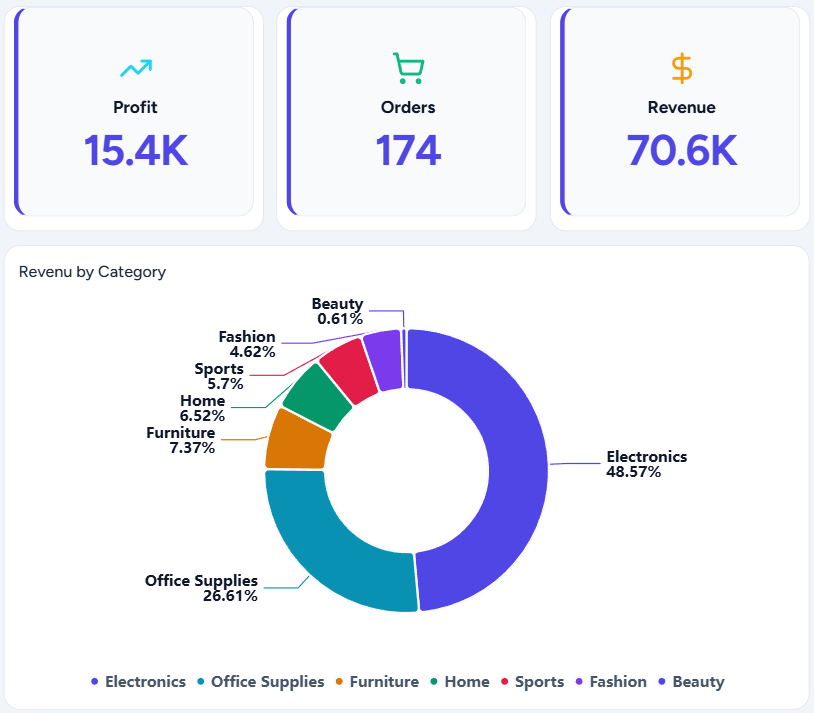
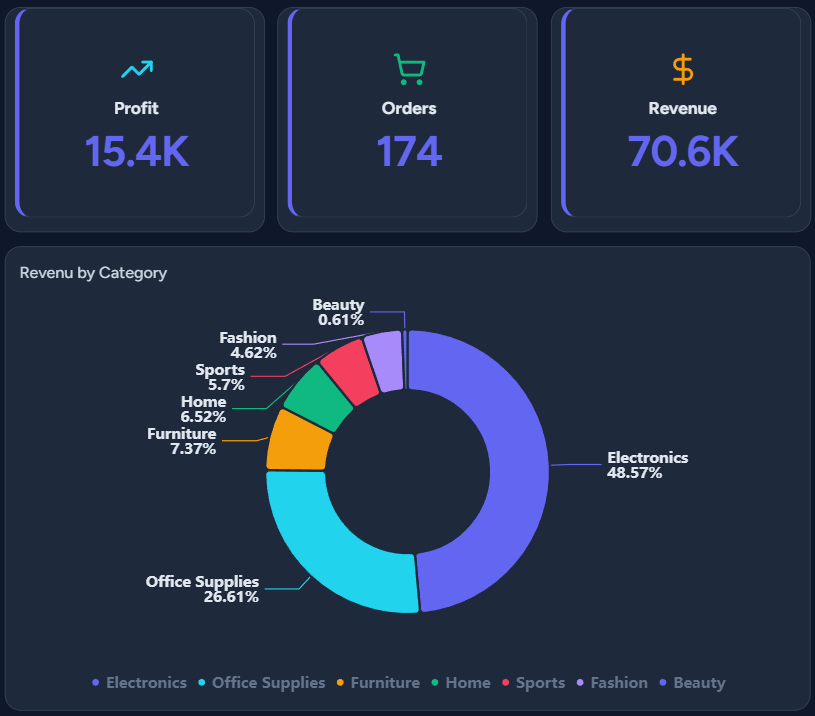
Professional by default.
Switch your dashboard between light and dark themes from a single dropdown — presentation-ready styles, modern visuals, and clean typography, with no design work required.
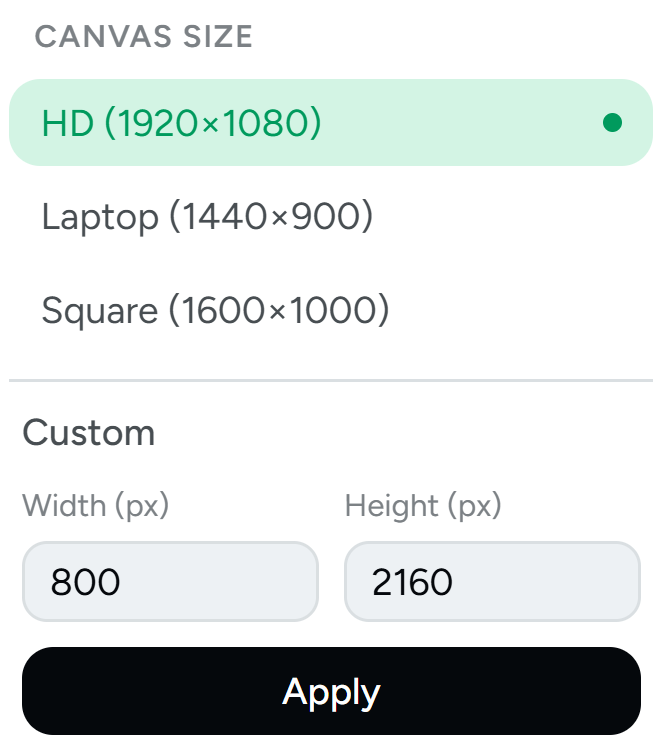
Built for however you present it.
Choose HD, laptop, or square canvas presets — or set a custom size. Build a dashboard for a written report, a lobby TV, or a slide in a client meeting, without fighting a one-size-fits-all layout.
Everything you need to tell your data's story
Build a chart in seconds
Pick fields in the sidebar and watch the chart render live — no formulas, no wizards.
12 chart types
Bar, line, pie, donut, KPI, clustered, multi-line, Pareto, pivot table, and more — plus slicers, text, and images.
Pivot tables
Cross-tab your data with row groups, totals, and sorting.
Slicers & filters
Click to filter — every chart on the page updates together instantly.
Link multiple tables
Connect related tables with relationships and build charts across them — no VLOOKUPs.
Export anywhere
Any chart to PNG, the whole dashboard to PDF, or cycle a slicer to export a PNG per value.
Multiple canvas sizes
HD, laptop, square, or a custom size — build for a report, a TV, or a slide.
Invite-only sharing
You choose exactly who can open a dashboard — nothing leaks if a link gets forwarded.
Beautiful themes
Presentation-ready light and dark styles, switched in one click.
Built for the reports you actually make.
Healthcare
Department KPIs, monthly hospital reports, exports per unit.
Sales
Pipeline, territory performance, a report per rep.
Finance
Budgets, actuals, and board-ready summaries.
Retail
Store and SKU performance at a glance.
Operations
Throughput, utilization, and live lobby displays.
Education
Enrollment, outcomes, and term-over-term trends.
Built by data analysts
Built by experienced data analysts who created dashboards for hospitals, finance teams, and businesses. Every feature solves a real reporting problem.
Your data stays yours
Your data is private by default. Share only with people you invite, and delete your files whenever you want.
Frequently asked questions
Can I upload Excel files?
Yes — Excel (.xlsx) and CSV files both work. Just drag the file in and start building.
Is Mizantiq really free?
There's a free plan that doesn't expire and needs no credit card — three dashboards, five viewers each, and the AI assistant connection. Paid plans start at $9 a month when you need more storage and higher limits. The free plan isn't going away.
Do the people I share with have to pay?
No. Viewers are included on every plan, including the free one. You pay for your own account; nobody you invite needs a licence of their own. See the pricing page for the full comparison.
Can I use Mizantiq instead of Power BI?
For building and sharing dashboards from Excel without viewer licenses, yes — most people reporting from spreadsheets don't need Power BI's complexity. For enterprise data models and direct warehouse connections, Power BI still fits better.
Can I combine more than one table?
Yes — upload multiple tables, link them with relationships on a visual canvas, and build charts that pull fields from across them, without writing a single VLOOKUP.
Do the people I share with need a company account?
No. You invite them by email and they sign in with any personal account — no company domain, no paid viewer license. You always control who has access; only people you've invited can open the dashboard.
Who can see a dashboard I create?
Only you, plus the exact people you invite by email. Nothing is public, and a forwarded link won't grant access to anyone you didn't invite.
Do I need to install anything?
No — Mizantiq runs entirely in your browser, so it works on Mac, Windows, or Linux with any modern browser.
Can I export to PDF or PNG?
Yes — export any single chart to a clean PNG, or the whole dashboard to PDF. You can also pick a slicer and export a PNG for every value in one click, for a single chart or the entire canvas.
Can I export a separate report for each region or department?
Yes. Pick a slicer, click export, and Mizantiq cycles through every value automatically — one PNG per branch, department, or salesperson — for a single chart or the whole canvas.
How do I update a dashboard when my data changes?
Upload the new version of your file. Mizantiq lines the new data up against your existing charts and walks you through any renamed columns, keeping your layout and formatting exactly as you built them.
Can I build a dashboard for a specific screen size?
Yes — choose from HD, laptop, or square presets, or set a custom canvas size. Useful for reports, TV displays, or slides.
Stop fighting Excel. Start building.
Finish reports in minutes, invite anyone to view them, and skip the BI learning curve entirely. Free to start — no credit card required.